使用 datashader 與 mercantile 建立 OpenStreetMap 圖磚系統
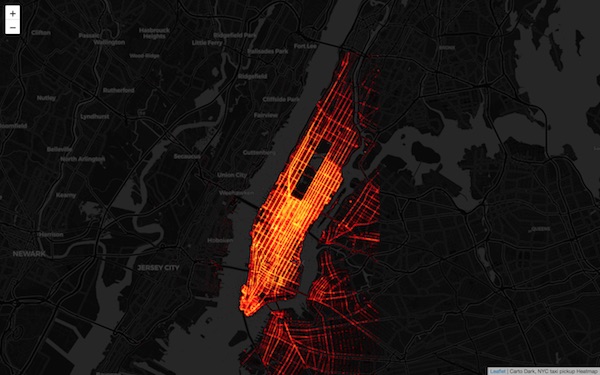
在先前的文章 Python 地圖視覺化 - 使用 Folium 中,我們已經介紹過如何使用 Python 與 datashader 套件將 GPS 資料繪製成圖片。本篇文章將進一步示範如何使用 NYC Taxi Trip Data 來建立 New York City 的計程車上車位置的 Heatmap,並把繪製出的 map tile 資料與 Folium 地圖元件整合以達到互動的效果。
OpenStreetMap tiles system
OpenStreetMap 是一個由 Steve Coast 所發起網路協作地圖計畫,目的是建立一個由使用者所共同建立的開放地圖服務。除了所有人都能免費使用該地圖服務外,使用者也可協助編輯地圖內容,上傳 GPS 路徑等資料,以完善地圖品質。現在著名的手機遊戲 Pokemon Go,也在 2017年底時將遊戲內的地圖資料,由先前所使用的 Google Map 轉移到 OpenStreetMap 上。
在建立地圖資料前,先介紹現在 OpenStreetMap 所使用的 Map tile system (圖磚系統)。由於地圖所包含的資料量非常龐大,所以地圖資料會依照所涵蓋區域的大小,分成許多小型的正方形區域,該區域稱為 tile(圖磚),每個區域的大小為 256x256 pixels。
Map tile coordinate
每個圖磚座標主要由三個部分組成,Zoom,X 與 Y。
- Zoom:地圖涵蓋區域的大小,數值最大代表範圍越廣( 0 為整個世界地圖範圍),最大範圍為 0 ~ 19
- X:地圖 X 座標軸,依照 Zoom 大小變化。範圍為 0 到 $$2^{zoom}-1$$。
- Y:地圖 X 座標軸,依照 Zoom 大小變化。範圍為 0 到 $$2^{zoom}-1$$。
可知當 zoom 越大時,tiles 的數量也會越來多,如當 zoom = 2 時,tiles 數量只有
$$2^2*2^2=16$$個。而當 zoom = 12 時,tiles 數量就會有
$$2^{12}*2^{12}=16,777,216$$個。當 zoom 每增加一層,tiles 數就會增加四倍。
使用地圖服務時,OpenStreetmap 會去設定的 tile server 拿取對應位置的圖片。如標準 OpenStreetMap 的 Tile Server URL 為
http://tile.openstreetmap.org/${zoom}/${x}/${y}.png
當移動到對應的範圍時,OpenStreetMap 就回去拿取對應位置的圖磚資料。如下圖所示,左圖為 zoom=0, x=0, y=0 的圖磚,可直接下列網址取得,如下表左方的圖片
http://tile.openstreetmap.org/0/0/0.png
而 zoom = 7, x = 63, y = 42 的圖磚則可由下列 URL 取得,如下表右方的圖片
http://tile.openstreetmap.org/7/63/42.png
| OSM (…/0/0/0.png) | OSM (…/7/63/42.png) |
|---|---|
 |
 |
除了標準 OpenStreetMap 的 tiles 外,也可由不同的 Tile Server 取得不同的圖磚加以應用,或自行建立 Tile Server 來使用自訂的圖磚。
| Stamen Toner | Stamen Watercolor |
|---|---|
 |
 |
關於 map tile 更詳細的解說可參考本篇文章。
Mercantile Package
除了前篇所提過的 datashader,Pandas,Dask 等之外 ,這次使用 Mercantile 這套由 Mapbox 所開源的 Spherical mercator coordinate 工具,來幫助我們從 tile 座標產生對應的經緯度或 web mercator 座標,或反過來產生包含特定座標的 map tiles 。
安裝
直接使用 python 的 pip 套件管理工具即可安裝 mercantile
pip install mercantile
使用範例
從 map tile 座標,取得對應的經緯度範圍
import mercatile

mercantile.bounds(603, 769, 11) # x=603, y=769, z=11
# LngLatBbox(west=-74.00390625, south=40.713955826286046, east=-73.828125, north=40.84706035607122)
從 GPS 座標產生對應的單一 Tile 物件
mercantile.tile(-74.00390625, -73.828125, 11)
# Tile(x=603, y=769, z=11)
從 GPS 座標與 zoom 範圍產生包含在內的 tile 列表
# 建立地圖範圍 (west, south, east, north)
bound_nyc = (-74.029495, 40.697930, -73.946411, 40.817817)

# 產生 zoom 範圍為 0 到 15 的所有 tile 的 generator
mercantile.tiles(*bound_nyc, zooms=list(range(0, 16)))
# len(list(tile_list)) = 212, 共有 212 個圖磚
從 Tile 物件取得 Web Mercator 座標
from mercantile import Tile
bound_xy = mercantile.xy_bounds(Tile(x=603, y=769, z=11))
# bound_xy = Bbox(left=-8238077.160463155, bottom=4970241.327215301, right=-8218509.281222151, top=4989809.2064563045)
之後將使用 mercantile 工具來建立所需產生的圖磚資料。
使用 NYC Taxi Trip Data 建立 Map Tiles
完整程式碼可至 GitHub 參考。
演算法概念
- 建立要繪製的 map tile 列表
- 使用 Mercantile 套件,對設定的範圍自動產生所有的 Tile 列表。
- 統計 map tile 範圍內每個點的資料數量
- 使用 datashader.Canvas.point 函數,對 map tile 範圍內進行統計。
- 將統計結果使用 pickle 與 gzip 序列化成壓縮檔儲存(*.pkl.gz)。
- 將每個點中的最大值儲存在 *.pkl.yaml 檔中方檢視。
- 不儲存無資料(全為零)的統計結果以節省空間。
- 尋找 zoom 中的最大值
- 統計 zoom 中的所有 tile 的最大值,並儲存在 _config.yaml 中。
- 依照統計資料,繪製每個 tile 圖片。
- 讀取 *.pkl.gz 並還原為統計物件來進行繪圖。
- 繪圖時使用 log 方法來進行內差計算,避免資料過於集中導致較少的點位看不出資料的問題。
- 繪圖時將範圍設為 [0, zoom_agg__max],避免不同 tile 做 interpolate 後得出的顏色範圍不統一的問題。
- 儲存圖片到指定路徑。
- 使用 Folium 套件來呈現結果。
下載 NYC taxi trip data
前篇的 datashader 視覺化使用 kaggle 上整理完畢的 dataset,這次我們直原始資料網站下載資料集。進入官網後可下載個年度的統計資料(使用 *.csv 格式),這裡我們使用 Yellow Taxi 在 2016 年 5 月份的資料。
目前有上下車 GPS 位置的資料中最多只到 2016 年 6 月。
也可在 Command Line 直接使用 wget 指令下載(該資料集約 1.8 GB)
wget https://s3.amazonaws.com/nyc-tlc/trip+data/yellow_tripdata_2016-05.csv
也可直接在 Python 中使用 os package來下達 wget 指令
import os
os.system("wget https://s3.amazonaws.com/nyc-tlc/trip+data/yellow_tripdata_2016-05.csv")
其他在 Python 中下載檔案的方式可參考這篇文章 - Download Files with Python
讀取 dataset
因我們只需要 GPS 座標,因此只需要讀取特定欄位的資料即可,這邊我們只讀取上車位置的經緯度欄位 pickup_longitude 與 pickup_latitude 即可。
import pandas as pd
import numpy as np

# 讀取 pickup_longitude 與 pickup_latitude 兩欄位
df = pd.read_csv("yellow_tripdata_2016-05.csv",
                 usecols=['pickup_longitude', "pickup_latitude"],
                 dtype={'pickup_longitude':np.float32,
                        "pickup_latitude":np.float32})
轉換 GPS 座標至 Web Mercator coordinate
因原始資料的座標使用的 GPS 為球面座標,因此須先轉換為 Web mercator coordinate 才能使用在 map tiles 的座標系統中。我們使用 pyproj 套件來轉換座標,將 pickup_longitude 與 pickup_latitude 的數值分別轉換到 pickup_x 與 pickup_y 欄位中。
# 定義轉換函數
from pyproj import transform, Proj

# Set project function
source = Proj(init="epsg:4326") # WGS84
target = Proj(init="epsg:3857") # Web mercator

# 轉換 Longitude 到 Web Mercator - X coordinate
def lngToX(lng):
    return transform(source, target, lng, 0)[0]

# 轉換 Latitude 到 Web Mercator - Y coordinate
def latToY(lat):
    return transform(source, target, 0, lat)[1]
之後將 dataframe 中的 Longitude 與 Latitude 轉換到 Web Mercator 中的 X, Y 座標中
df['pickup_x'] = df.pickup_longitude.apply(lngToX)
df['pickup_y'] = df.pickup_latitude.apply(latToY)
注意,GPS 所使用的 WGS84 能投影轉換到 Web Mercator 的範圍有限制,Longitude 為 [-180, 180],而Latitude 為 [-85.0511, 85.0511],使用前須先過過濾掉超出範圍的數值資料。
使用 Dask 平行處理 Dataframe
因 Pandas 是 single thread 架構,無法發揮多處理器的功能,因此我們使用 Dask 來讓 dataframe 能使用多處理器平行處理,以增加處理速度。
import dask.dataframe as dd
import multiprocessing as mp

dask_df = dd.from_pandas(df, npartitions=mp.cpu_count())
dask_df.persist()
建立所要產生的 Map Tile 列表
使用 Mercantile 建立所要產生的 map tiles。
import mercantile

# New York City 周邊範圍
bound_nyc = (-74.029495, 40.697930, -73.946411, 40.817817)

# 產生 zoom 範圍為 [0, 15],在 bounds_nyc 中的所有 tiles
tile_list = list(mercantile.tiles(*bounds_nyc, zooms=list(range(0, 16))))
建立 Aggregation 資料並寫入檔案中
當資料準備好後對每個 tile 範圍進行統計,並依照 tile 位置將 aggregation 資料寫入指定位置的檔案中。這步驟會產生兩個檔案,一個為該 tile 進行 aggregate 後產生的資料進行序列化並壓縮後的檔案,以 *.pkl.gz 表示。另一個則為記錄該 tile 中最大點數資料的 yaml 檔,以 *.pkl.yaml 表示。
import gzip, pickle

# 由 tile 資訊產生 Canvas 物件,並使用 pickup_x 與 pickup_y 的資料進行統計後產生 aggregation 物件
cvs = mapTilesCanvas(*tile)
agg = cvs.points(dask_df, 'pickup_x', 'pickup_y')

# 將 aggregation 物件內容用 gzip 壓縮後寫入檔案
agg_file = # *.pkl.gz
with gzip.open(agg_file, mode='wb') as f:
    pickle.dump(agg, f)

# 將 aggregation 中的最大值寫入 yaml 檔案中
agg_yaml_file = # *.pkl.yaml
with open(agg_yaml_file, mode='w') as f:
    yaml_obj = {"max_count": int(agg.values.max())}
    yaml.dump(yaml_obj, f, default_flow_style=False)
建立每個 zoom 中的最大點數資料
尋訪每個 zoom 中的 *.pkl.yaml 檔案,取得 max_count 的數值並與目前 zoom 中的最大值進行比較,若比現有最大值大則以該數值取代現有最大值。全部尋訪完畢可取得現有 zoom 中的最大點數值並寫入 _config.yaml 檔中。
zoom_yaml_file = # 每個 zoom 資料夾位置下都有一個 _config.yaml 檔案
with open(zoom_yaml_file, 'w') as file:
    yaml_obj = {'zoom_max_count': max_count}
    yaml.dump(yaml_obj, file, default_flow_style=False)
產生每個 Aggregation 檔案對應的 Tile Image
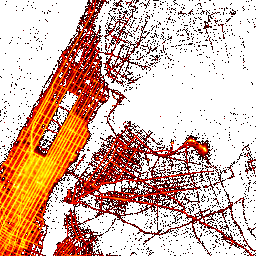
在相關資料都產生完後,接著我們開始產生所需要使用的 Map tile 圖檔。主要步驟為取出每個 aggregation 的檔案並使用其繪製 png 圖檔並儲存至對應的 folder 中。繪圖方式使用 log 且最大最小值範圍為 0 到 zoom_max, 使相同 zoom 中不同 tile 的顯示狀況能盡量一致。
import datashader.transfer_functions as tf
from matplotlib.cm import hot

# 取出每個 zoom 的最大統計
max_dict = getMaxCountDict(agg_root)
agg_path = # aggregation 檔案位置

with gzip.open(agg_path, 'rb') as f:
    agg = pickle.load(f)
    zoom, xtile, ytile = getMapTileCoord(agg_path)
    img = tf.shade(agg, cmap=hot, how='log', span=[0, max_dict[zoom]])

    tile_path = # 影像儲存位置
    with open(tile_path, mode='wb') as f:
        f.write(img.to_bytesio(format='png').read())
完成後 map tile 會儲存在 {tile_root}/{z}/{x}/{y}.png 的位置中,我們可以將檔案放到 server 上讓其他地圖服務使用圖磚資料。這我們使用 GitHub 來存放 map tiles 讓 Folium 直接使用圖檔資料。
使用 Folium 顯示 map tile
在前篇已經介紹過如何使用 Folium 地圖套件顯示地圖資料,因此我們可使用 Folium 來加入放在 GitHub 上的圖層資料,並將地圖匯出成 html 檔案以供檢視。
import folium

# 使用 Carto Dark 建立底圖
fmap = folium.Map(location=[40.772562, -73.974039],
                  tiles='https://cartodb-basemaps-{s}.global.ssl.fastly.net/dark_all/{z}/{x}/{y}.png',
                  zoom_start=12,
                  attr='Carto Dark')

# 加入放在 GitHub 存放的 map tiles 位置
fmap.add_tile_layer(tiles='https://raw.githubusercontent.com/yeshuanova/nyc_taxi_trip_map/master/map/tile/{z}/{x}/{y}.png',
                    attr='NYC taxi pickup Heatmap')

# 儲存地圖為 html 檔,可直接用瀏覽器打開檢視地圖資訊
fmap.save('map.html')

# 直接在 ipython 中顯示地圖
fmap
最後可得到如下的顯示結果,可看出地圖有正確顯示出上車熱點,

若要嘗試操作,也可由此連結檢視互動式地圖。

